
For students applying to medical school with slightly below average GPAs of 3.20-3.39 and slightly below average MCAT scores of 24-26 (first column in the table), black applicants were more than 8 times as likely to be admitted as Asians (67.3% vs. 7.7%), and more than 5 times as likely as whites.
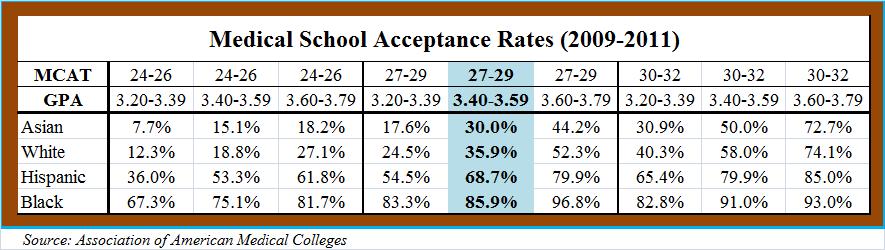
The chart above (click to enlarge) is an update of the chart from this CD post from about a year ago, showing medical school acceptance rates for Asians, whites, Hispanics and blacks based on data from the Association of American Medical Colleges (AAMC) for the years 2009-2011 (aggregated).
For 2011, the average GPA of students applying to medical schools was 3.53 and the average total MCAT score was 28, and the chart displays the acceptance rates for students applying to medical schools with average GPAs (3.40-3.59) and average MCAT scores (27-29) in the highlighted blue column, and the acceptance rates for those students with slightly higher and slightly lower than average GPAs and test scores in the other columns. In other words, the table displays acceptance rates by race and ethnicity for students applying to medical school with average academic credentials (or just slightly above or below average). Here are some observations:
1. For those students applying to medical school with average GPAs (3.40 to 3.59) and average MCAT scores (27-29), black applicants were almost three times more likely to be admitted than their Asian counterparts (85.9% vs. 30%), and 2.4 times more likely than their white counterparts (85.9% vs. 35.9%). Likewise, Hispanic students with average GPAs and average MCAT scores were about twice as likely to be accepted as white applicants (68.7% vs. 35.9%), and more than twice as likely as Asian applicants (68.7% vs. 30%).
[…]
![]()
![]()
![]()
![]()